Every Five Minutes
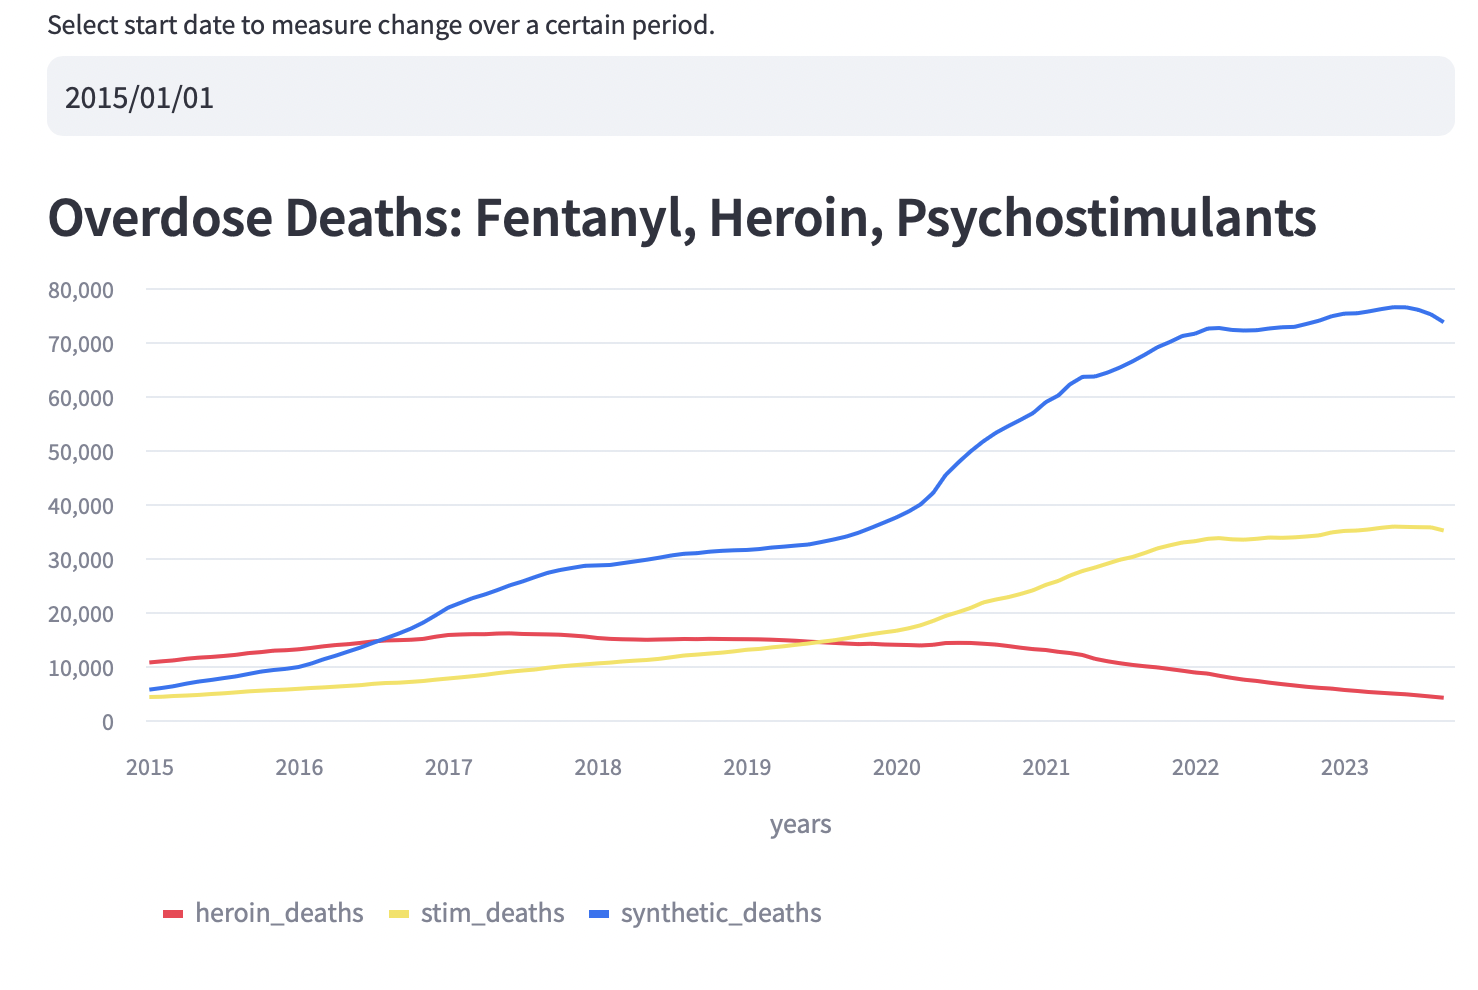
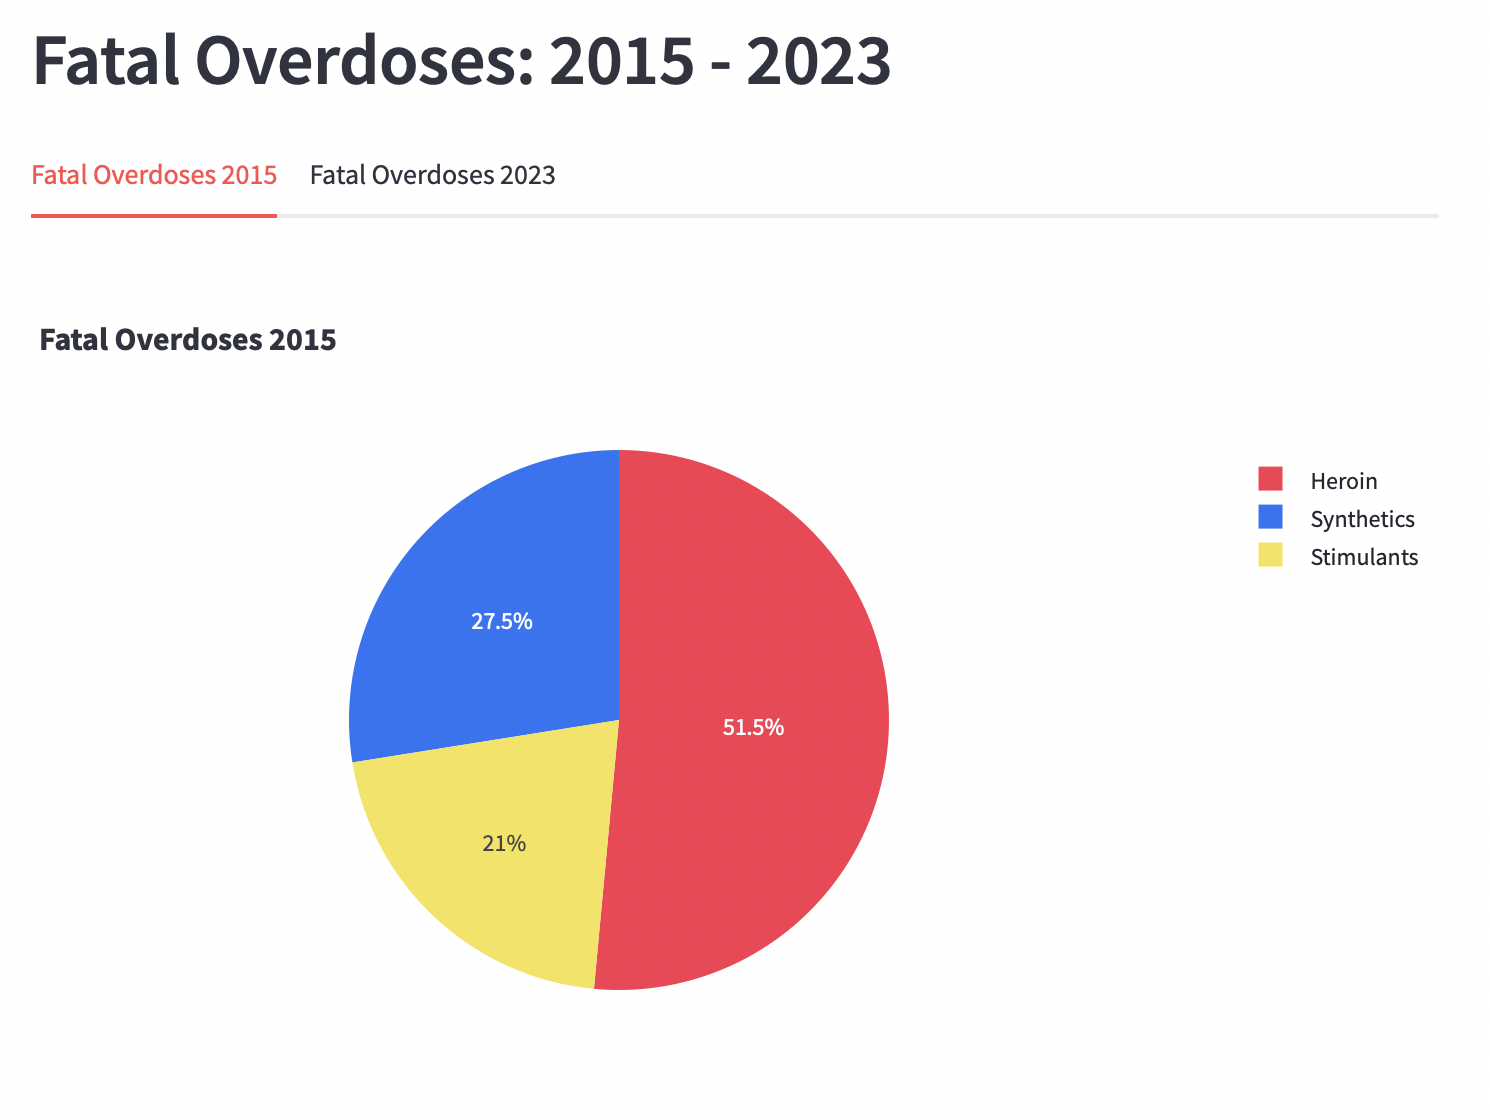
The overdose crisis in the United States continues to take a devastating toll on individuals, families, and communities across the nation. In response to this urgent public health issue, my project is designed to analyze and visualize critical aspects of the overdose crisis using Streamlit, a robust web application framework, alongside a suite of Python libraries.
My project uses a wide array of data sources, including government-verified public health and incarceration datasets along with geographical data, to provide comprehensive insights into the magnitude and complex nature of the overdose crisis. The project aims to uncover and observe the underlying patterns, trends, and disparities related to overdose fatalities and criminalization efforts by integrating data preprocessing techniques, statistical analysis, and state-of-the-art visualization methods.
Key features of the project include interactive data exploration tools, dynamic visualizations, and user-friendly interfaces. These enable policymakers and student researchers alike to gain deeper insights into the intricate nature of the overdose crisis. Moreover, the project assesses the unequivocal economic competence of the overdose crisis and opioid use disorder. By comparing the relative costs of incarceration and recovery programs, my project hopes to reinvigorate conversations through data-driven results about the stigmatization and criminalization of substance abuse disorders.
The Streamlit-based approach facilitates seamless deployment and accessibility, allowing users to interact with the project’s findings through intuitive web applications without requiring extensive programming knowledge. By democratizing access to critical information and insights, the project aims to empower users with the tools and expertise to conduct evidence-based investigations, informed policy decisions, and public health strategies to address the overdose crisis and mitigate its present and devastating impact on society.
Here is the link to the Streamlit web application used to visualize these analyses and more: Every Five Minutes


